You are using an out of date browser. It may not display this or other websites correctly.
You should upgrade or use an alternative browser.
You should upgrade or use an alternative browser.
HWiNFO64 CPU Die (Average) Spike?
- Thread starter Venoxium
- Start date
Yeah, first thing I did when I built my pc, could this be a bug in sensors since the cpu wouldve been fried?You have latest BIOS for your board?
Also manually set the soc voltage limits to 1.1 in bios but readings were pretty similar still
Update: went back into bios and set up the manual voltages to 1.25 and disabled amd experience and now temps and voltages are fine
Last edited:
Good thing you manually set SoC voltage. Anything below 1.3V is fine for Zen4.Yeah, first thing I did when I built my pc, could this be a bug in sensors since the cpu wouldve been fried?
Also manually set the soc voltage limits to 1.1 in bios but readings were pretty similar still
Update: went back into bios and set up the manual voltages to 1.25 and disabled amd experience and now temps and voltages are fine
Yeah its probably a bug, but I cant tell what kind and how deep goes... and something tells me its not just software reading error. Otherwise @Martin would've fix it by now.
You know what I mean if you read the thread from start.
Since I have a Zen3 (5900X) system and my knowledge of AM5 is limited, what exactly is AMD Experience?
It's a program that's like msi afterburner and nvidia geforce experience but it also tracks your gaming fps/stuff like that. let's you record and stream, shows your display settings and all the features to turn on/off. It's like a hub for all those individual programs.Good thing you manually set SoC voltage. Anything below 1.3V is fine for Zen4.
Yeah its probably a bug, but I cant tell what kind and how deep goes... and something tells me its not just software reading error. Otherwise @Martin would've fix it by now.
You know what I mean if you read the thread from start.
Since I have a Zen3 (5900X) system and my knowledge of AM5 is limited, what exactly is AMD Experience?
Read somewhere that running multiple system monitoring programs bugs hwinfo readings, since the amd program also monitors that I tried disabling it and sure enough values were back to normal.
Attachments

Oh that from Adrenalin...It's a program that's like msi afterburner and nvidia geforce experience but it also tracks your gaming fps/stuff like that. let's you record and stream, shows your display settings and all the features to turn on/off. It's like a hub for all those individual programs.
Read somewhere that running multiple system monitoring programs bugs hwinfo readings, since the amd program also monitors that I tried disabling it and sure enough values were back to normal.
Yeah I always have it on custom.

Same issue on my build:
Windows 11 Pro (recently updated)
CPU: AMD Ryzen 7 7800X3D
MB: ASUS ROG STRIX B650E-E GAMING WIFI (Updated to Bios 2413)
RAM: G.Skill Trident Z5 NEO EXPO black DDR5-6000 DIMM CL30-38-38-96 Dual Kit 32GB
GPU: ASUS TUF Radeon RX 7900 XT Gaming OC
PSU: 850 Watt MSI MPG A850G PCIE5 Modular
Windows 11 Pro (recently updated)
CPU: AMD Ryzen 7 7800X3D
MB: ASUS ROG STRIX B650E-E GAMING WIFI (Updated to Bios 2413)
RAM: G.Skill Trident Z5 NEO EXPO black DDR5-6000 DIMM CL30-38-38-96 Dual Kit 32GB
GPU: ASUS TUF Radeon RX 7900 XT Gaming OC
PSU: 850 Watt MSI MPG A850G PCIE5 Modular
Attachments
Last edited:
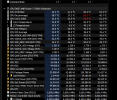
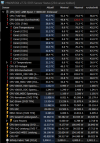
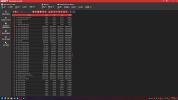
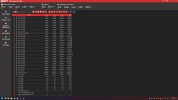
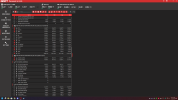
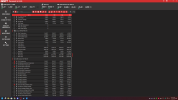
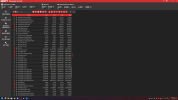
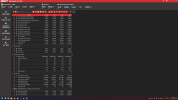
This is now happening in OCCT monitoring as well as HWinfo64. Earlier I posted HWinfo64 screenshots, so here are OCCT screenshots to go with it. 
Should I continue using my machine or should I be worried.
I have attached Images of all of the sensors OCCT was tracking if anyone wants to sift through and see if everything seems normal.
I am aware this is HWinfo forum, but the spike is now not just a HWinfo bug. HWinfo was closed out completely, while OCCT was running in the background to track temps while gaming.
Attachments
-
 Screenshot (48).png301.4 KB · Views: 4
 -
 Screenshot (49).png317.8 KB · Views: 4
 -
 Screenshot (50).png283.9 KB · Views: 4
 -
 Screenshot (51).png280.2 KB · Views: 3
 -
 Screenshot (52).png291.9 KB · Views: 3
 -
 Screenshot (53).png323.4 KB · Views: 3
 -
 Screenshot (54).png274.9 KB · Views: 4
 -
 Screenshot (55).png295.5 KB · Views: 5
From my understanding its not error reading by any software but error reporting by CPU (telemetry?).
Im seeing some false readings that are impossible to be true
Thats why @Martin said the quote below.
Im seeing some false readings that are impossible to be true
Thats why @Martin said the quote below.
Those spikes (which seem to be exactly double of what it should be) are in fact invalid/misreporting. So no damage can happen because of this, it's just a misreporting bug that should be fixed by AMD. It should be possible to fix it a BIOS update once they locate the bug.
Oh okay. Thanks.From my understanding its not error reading by any software but error reporting by CPU (telemetry?).
Im seeing some false readings that are impossible to be true
Thats why @Martin said the quote below.

I see. You're right. Thanks.
Just had this problem on ROG x570/5900x with newest AGESA 1.0.0.2.B (v.5003). just updated bios {bcz recent bitlocker exploit) and changed FLCK to 2000 from 1800 to be 1:1 with my 4000mt/s ram and upped CPU current capability to 110%, ran RAM test fine on passmark then played an hour of BF1 w hwinfo running
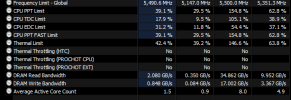
cpu (tctl/Tdie) got as high as 71.8c (maximum) but CPU Die avg shows 121.0c max peak
using 360mm aio and badjrillion fans cpu doesn't typically go above 72
gonna try to get this while logging as I've heard would help
cpu (tctl/Tdie) got as high as 71.8c (maximum) but CPU Die avg shows 121.0c max peak
using 360mm aio and badjrillion fans cpu doesn't typically go above 72
gonna try to get this while logging as I've heard would help
does OCCT and HWinfo use the same information from the mobo/components to compile the temp info maybe?This is now happening in OCCT monitoring as well as HWinfo64. Earlier I posted HWinfo64 screenshots, so here are OCCT screenshots to go with it. View attachment 10731
Should I continue using my machine or should I be worried.
I have attached Images of all of the sensors OCCT was tracking if anyone wants to sift through and see if everything seems normal.
I am aware this is HWinfo forum, but the spike is now not just a HWinfo bug. HWinfo was closed out completely, while OCCT was running in the background to track temps while gaming.
does OCCT and HWinfo use the same information from the mobo/components to compile the temp info maybe?
Yes
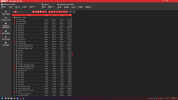
Hi, Martin. I'm not sure if it is useful. So I was testing fclk on my 7800x3d, i found that when i rub karhu ( 24GB) and timespy extreme ( test 2, looped, window enabled) . I can reproduce the spike temp for CPU Die(average) and those three voltage SVI3 TFN also double. In the latest hwinfo, it also report IOD hotspot >90C ( normally just 40C) . Frequency Limit - Global goes above 10GHz lol.
I tested in both 14C and 30C ambient, same issue occurs.
I think whatever causing it just read the same data and count as twice or something like that.
Cheers
Edit: I think i found the problem. I went to my bios and changed all vrm switching frequency ( cpu, vsoc, vmisc and vdd) to max, 800 for cpu and 700 for the rest on my gene4. Re-run the test and everything seems reported correctly. A bit too soon to say but this probably the issue where vrm couldn't catch up during trasient loads, maybe ppl w pld psu experience this more. Just my guess.
Edit: add some photo before and after changing vrm switch frequency.
Before

After

Tbh I have no idea what cause all the spike.
Last edited:
Hello
Maybe a bit late but just registered to also add my case.
Win11 Pro updated
5600x am4 with 240mm AIO (I know overkill, but I rather have a CPU that doesn't go over 60ºc under heavy load)
AsRock B550m pro4 Bios p3.40
Gskill 2x16GB 3600 CL18
6700xt
I've noticed this lately but I'm not sure how long this has been going on, and if it happened before I updated to Bios p3.40 because I normaly use hwinfo to show me the bottom part of the sensors to show me the sections of MB and GPU and in MB it shows the cpu temperature.
It was only when running a cinebench r23 to see if my cores would hit max speed that I left it in CPU section visible and went gaming a little bit after it an realized some strange values here:

For me the strange values are only the CPU Die (average) and the CPU EDC and the CPU EDC Limit.
This is only one print, I've had diferent results, some only spike on CPU Die (average) with CPU EDC 90.000 A and CPU EDC Limit 100%, some spike way higher than 100% on the EDC like this print from yesterday that reached 133.713 A, 148.6%.
Have not got any double values on SoC Voltage or CPU Core VID.
I've read here that it could be caused by using also another OSD like the Adrenalin one and for 2 days, it was ok only using HWiNFO, but yesterday got another spike without any other OSD.
Btw when I'm doing work, and use VM etc, using about half the available RAM, there is no problem, this only happens sometimes when HWiNFO window is on the background because I'm running a game.
After reading all this thread I got a little bit more relaxed, thanks to @Martin , but still I wanted to add my case because it is not am5 only, and it is not Asus or Gigabyte or MSI only, so I think we could rule out mobo brand, CPU socket or CPU Cooler type.
Maybe a bit late but just registered to also add my case.
Win11 Pro updated
5600x am4 with 240mm AIO (I know overkill, but I rather have a CPU that doesn't go over 60ºc under heavy load)
AsRock B550m pro4 Bios p3.40
Gskill 2x16GB 3600 CL18
6700xt
I've noticed this lately but I'm not sure how long this has been going on, and if it happened before I updated to Bios p3.40 because I normaly use hwinfo to show me the bottom part of the sensors to show me the sections of MB and GPU and in MB it shows the cpu temperature.
It was only when running a cinebench r23 to see if my cores would hit max speed that I left it in CPU section visible and went gaming a little bit after it an realized some strange values here:
For me the strange values are only the CPU Die (average) and the CPU EDC and the CPU EDC Limit.
This is only one print, I've had diferent results, some only spike on CPU Die (average) with CPU EDC 90.000 A and CPU EDC Limit 100%, some spike way higher than 100% on the EDC like this print from yesterday that reached 133.713 A, 148.6%.
Have not got any double values on SoC Voltage or CPU Core VID.
I've read here that it could be caused by using also another OSD like the Adrenalin one and for 2 days, it was ok only using HWiNFO, but yesterday got another spike without any other OSD.
Btw when I'm doing work, and use VM etc, using about half the available RAM, there is no problem, this only happens sometimes when HWiNFO window is on the background because I'm running a game.
After reading all this thread I got a little bit more relaxed, thanks to @Martin , but still I wanted to add my case because it is not am5 only, and it is not Asus or Gigabyte or MSI only, so I think we could rule out mobo brand, CPU socket or CPU Cooler type.
Last edited:
Came here to report the same, confused because the AVG was higher than the single highest DIE temp, but Ive really got no clue how any of this works.
As far as I understood this thread theres no reason for concern ?
Maybe someone can confirm this for me
MSI Pro B650-S Wifi
AMD 7800x3D
EDIT to add cpu cooler: Thermaltake Peerless Assassin (mounted literally two days ago)
Running, HWMonitor, HWinfo, AMD adrenaline
Playing different games but also just Desktop activity, second day in a row this happened.
sadly my screenshots will be in German
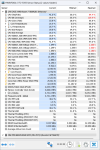
Below is your screenshot with some highlights of all the buggy values your CPU reports.Came here to report the same, confused because the AVG was higher than the single highest DIE temp, but Ive really got no clue how any of this works.
As far as I understood this thread theres no reason for concern ?
Maybe someone can confirm this for me
MSI Pro B650-S Wifi
AMD 7800x3D
EDIT to add cpu cooler: Thermaltake Peerless Assassin (mounted literally two days ago)
Running, HWMonitor, HWinfo, AMD adrenaline
Playing different games but also just Desktop activity, second day in a row this happened.
sadly my screenshots will be in German
View attachment 10912View attachment 10913
They are exactly x2 of what they should be.
So yeah its not of a concern other than why AMD didnt fix this bug yet.

Hey folks,
Just registered to report the same issue. Occurred while playing PUBG. Second time.
My spec: MSI B650I Edge WiFi, 7800X3D, 7800XT.
Built my PC a few days ago. The chipset drivers are new (6.02.07.2300). The BIOS version is 7D73v16. AMD Adrenalin Edition was opened in the background and nothing more, that reads sensors.
Looks like, some values just multiplied by two.
Attachments
Similar threads
- Replies
- 2
- Views
- 1K
- Replies
- 12
- Views
- 7K